
Market Overview
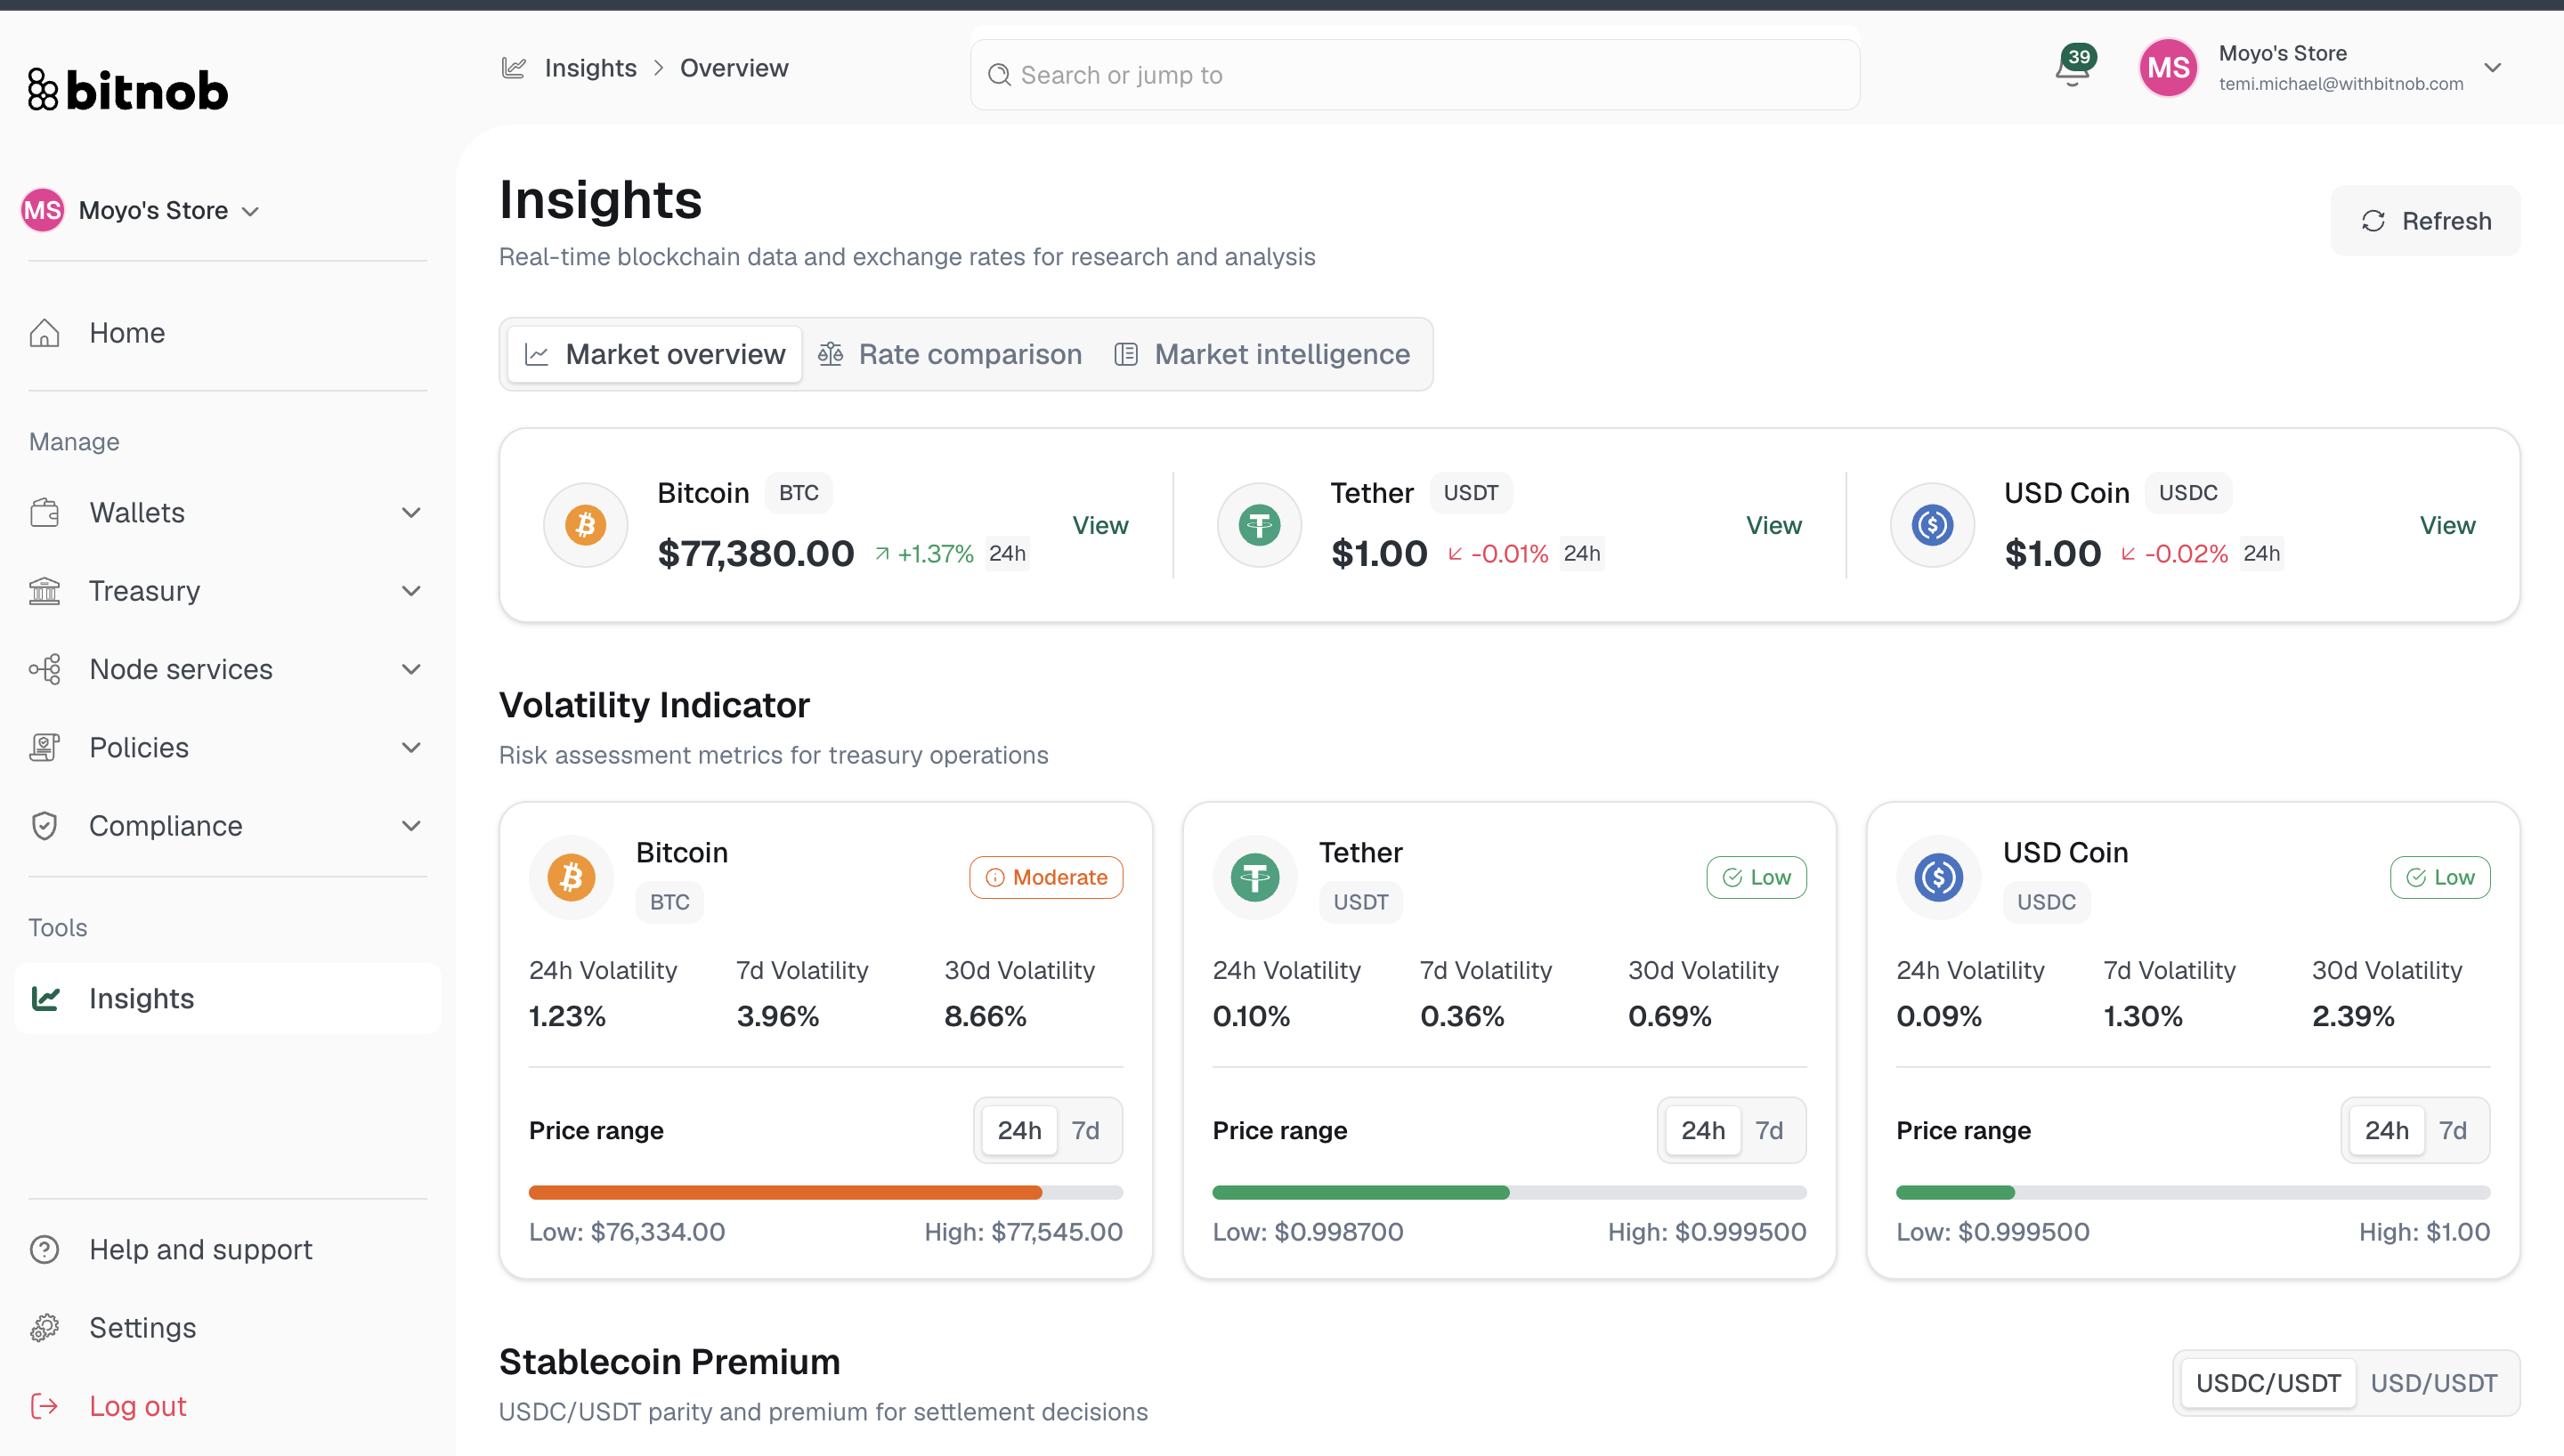
The Market Overview tab is your live dashboard for asset prices, volatility, stablecoin parity, network fees, and cross-exchange rates.
Asset Prices
At the top of the page, supported assets are displayed with their current price and 24-hour change. Currently tracked assets include Bitcoin (BTC), Tether (USDT), and USD Coin (USDC). Click View on any asset to open the coin detail view, which shows:
A price history chart filterable by 1H, 24H, 1W, 1M, and 1Y
24-hour price change percentage
Market cap
24-hour trading volume
Volatility Indicator
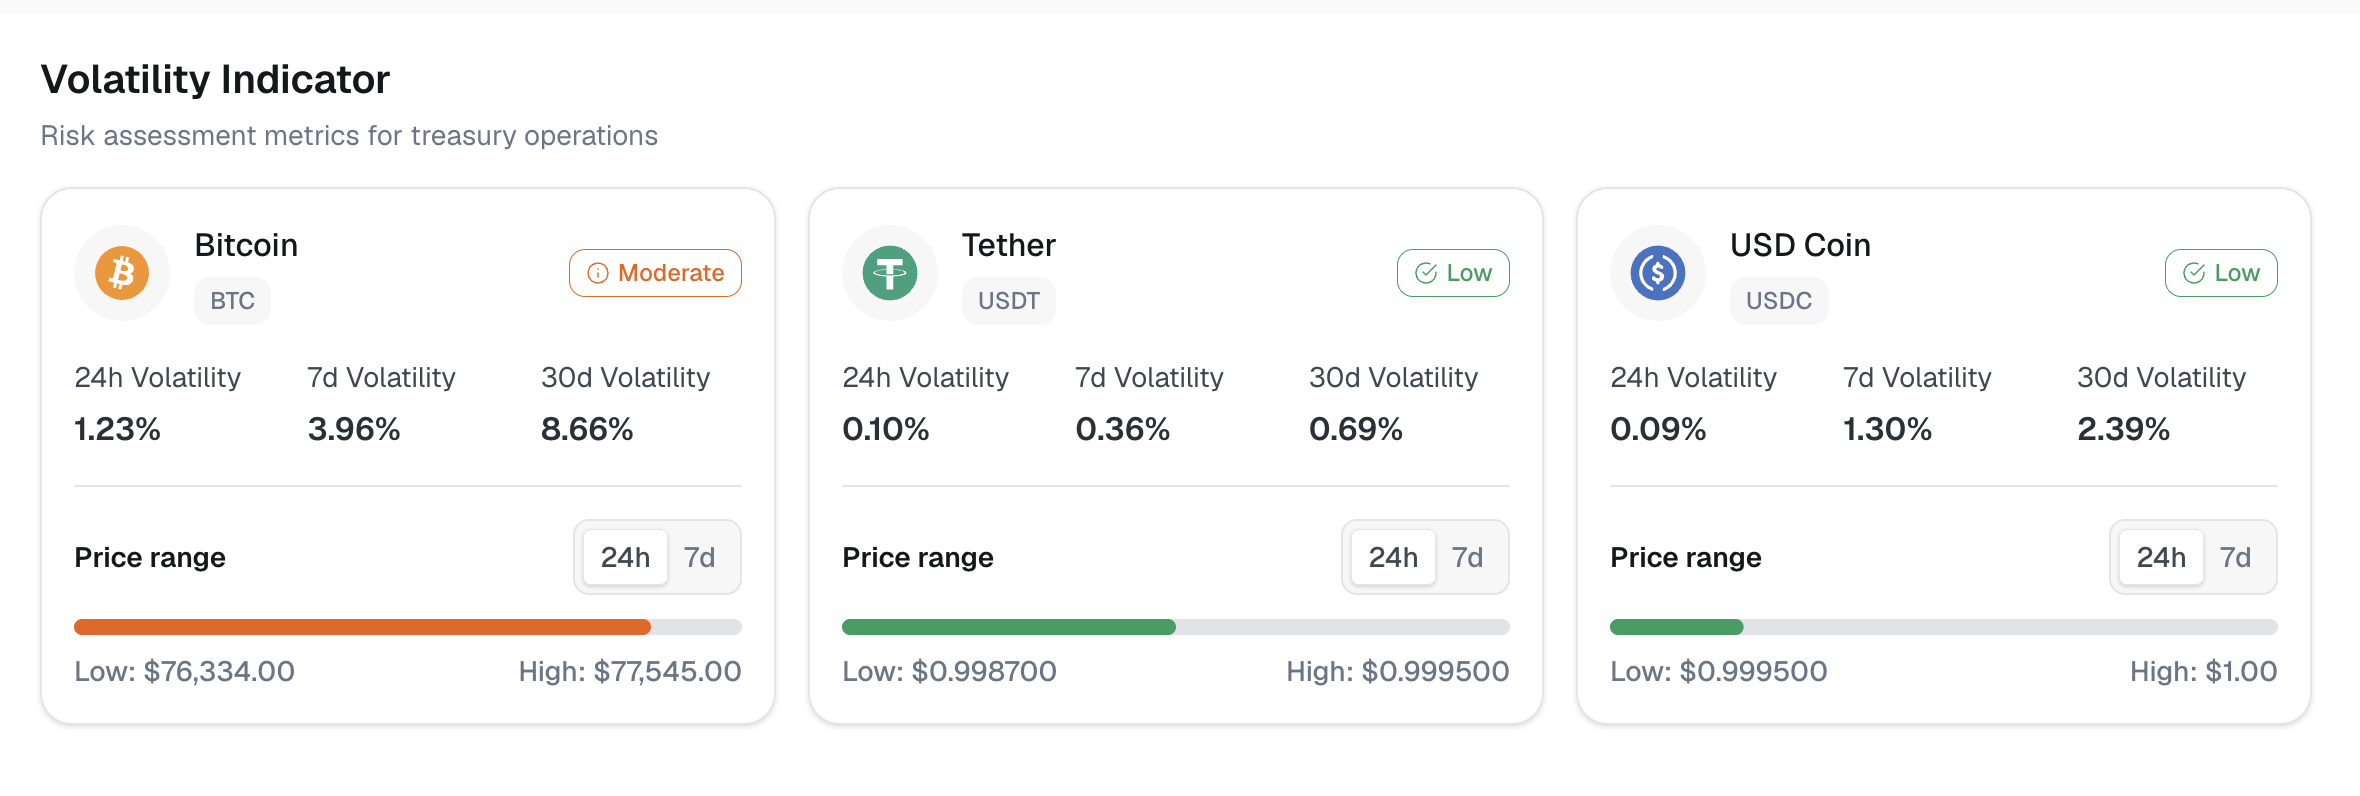
Below the asset prices, the Volatility Indicator provides risk assessment metrics for treasury operations. For each asset you can see:
Risk level — Categorized as Low, Moderate, or High
24h, 7d, and 30d volatility — Expressed as a percentage
Price range — The low and high over the last 24 hours and 7 days
Stablecoin Premium
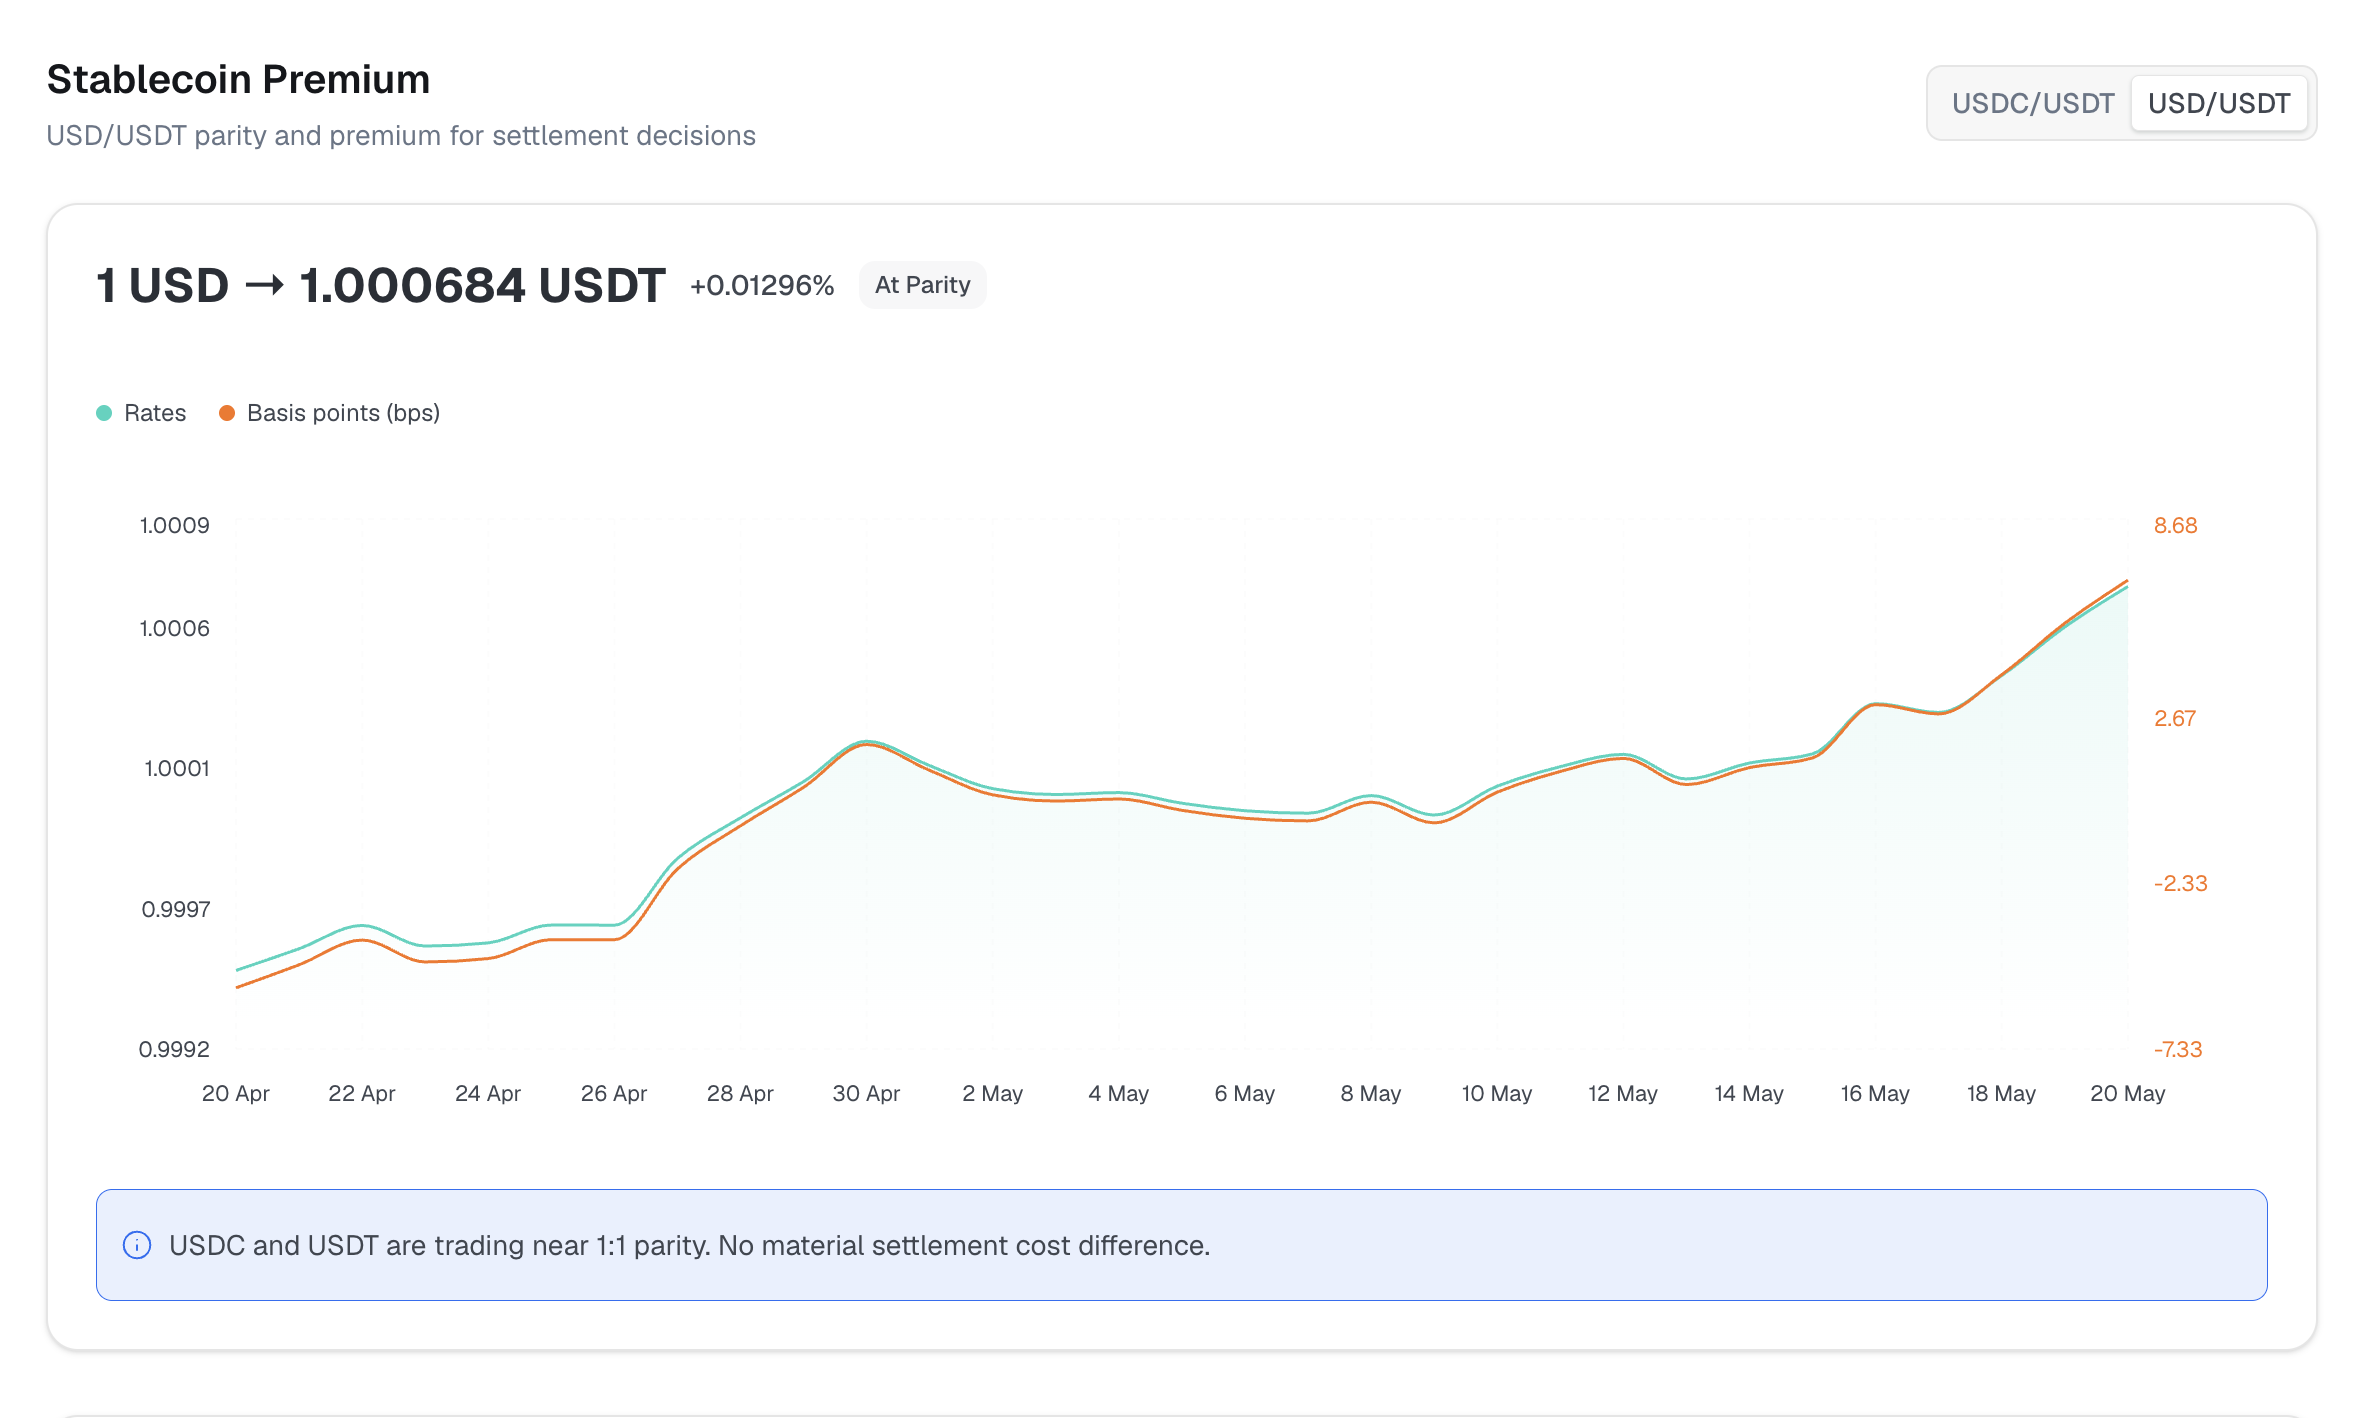
This section tracks the parity between stablecoins to help with settlement decisions. It shows:
USDC/USDT — The current rate of 1 USDC in USDT, the percentage premium or discount, and whether the pair is at parity
USD/USDT — The same view for USD against USDT
A chart shows the rate and basis points movement over time, with a plain-language summary of what the current parity means for settlement.
Network Fees
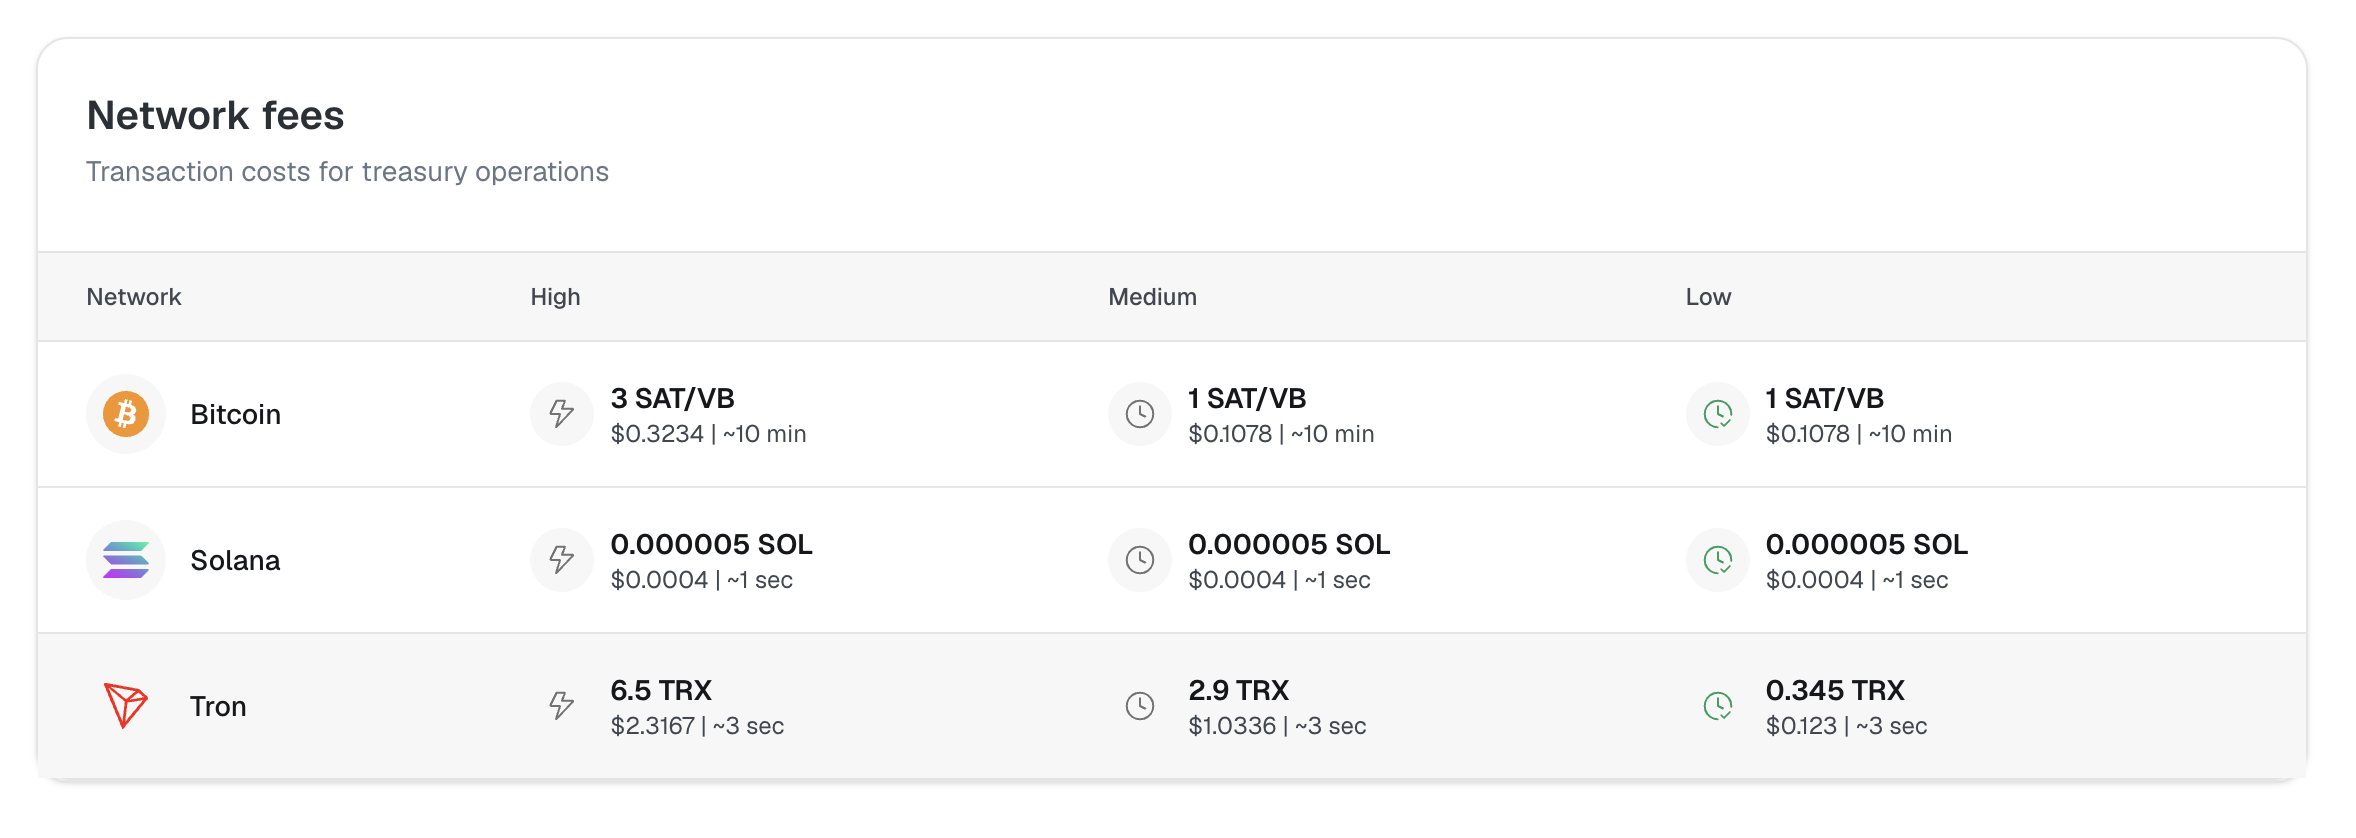
The Network Fees table shows the current transaction costs for treasury operations across supported networks. For each network, fees are broken down into three priority tiers:
High — Fastest confirmation, highest cost
Medium — Balanced speed and cost
Low — Slowest confirmation, lowest cost
Each entry shows the fee in native token units, the USD equivalent, and the estimated confirmation time. Currently tracked networks include Bitcoin, Solana, and Tron.
Cross-Exchange Rates
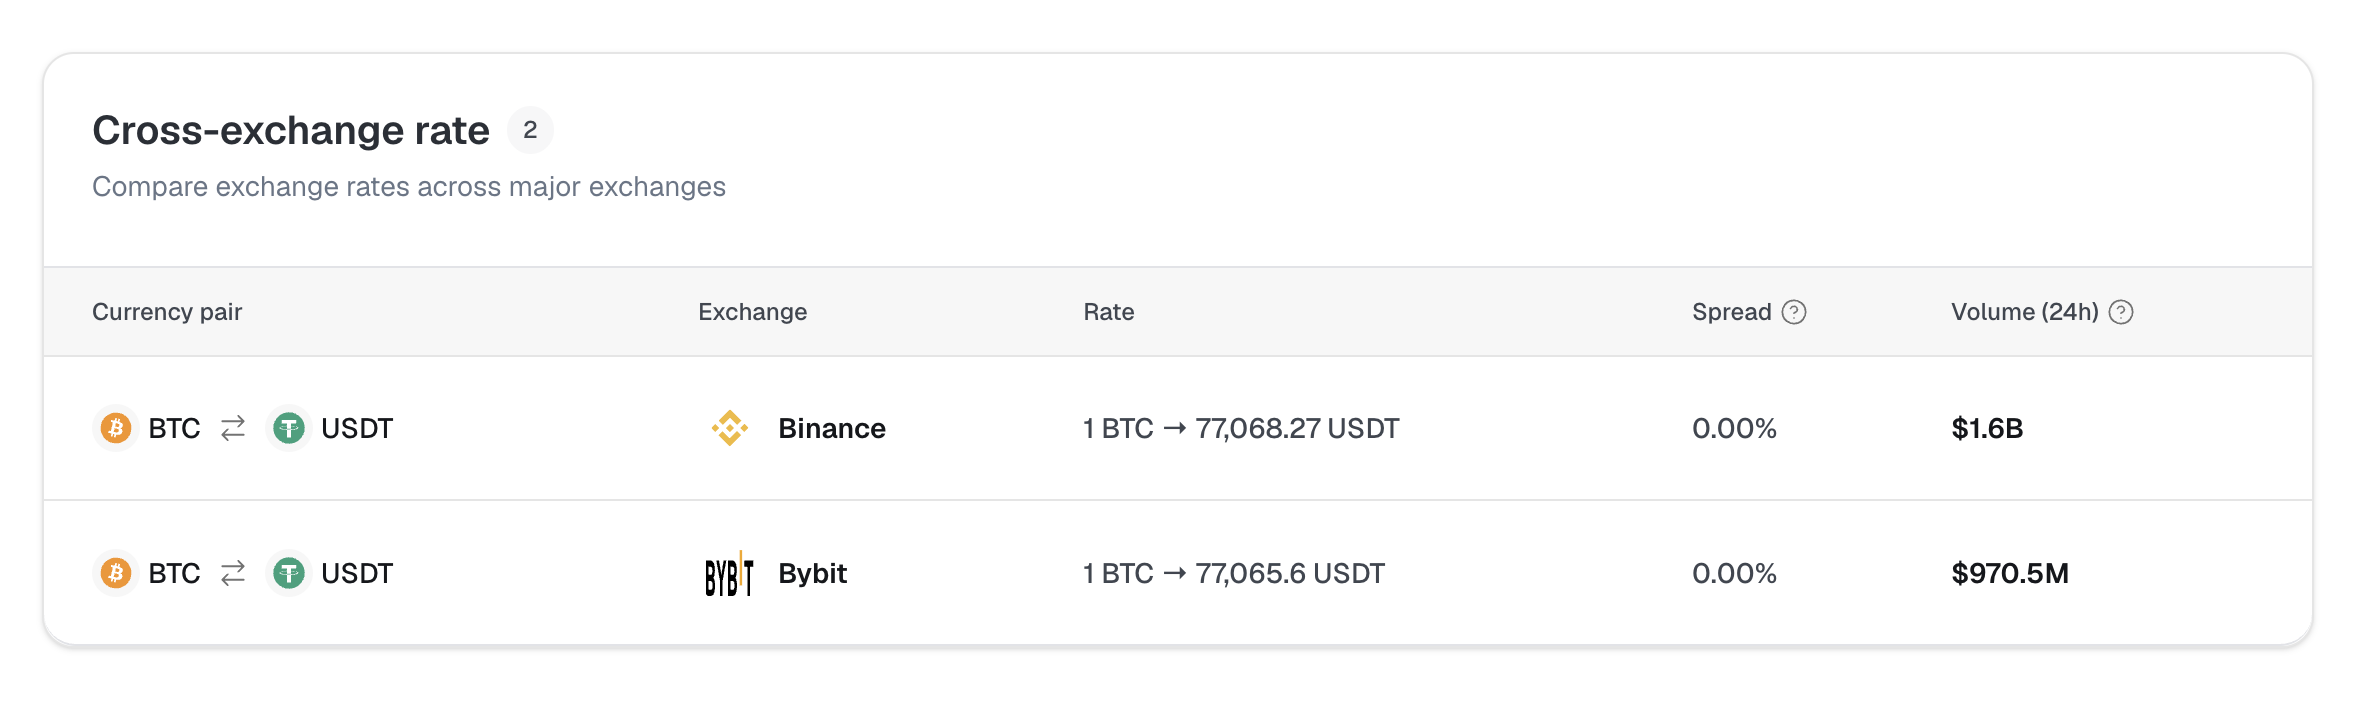
At the bottom of the Market Overview tab, the Cross-Exchange Rates table lets you compare rates for a currency pair across major exchanges side by side. Each row shows the exchange, the current rate, the spread, and the 24-hour trading volume.
Related articles