
How to Navigate the Business Dashboard
To access the Bitnob Business dashboard, click Visit Bitnob Business from the Bitnob Business button on the Bitnob Settings Overview. This launches the operational dashboard
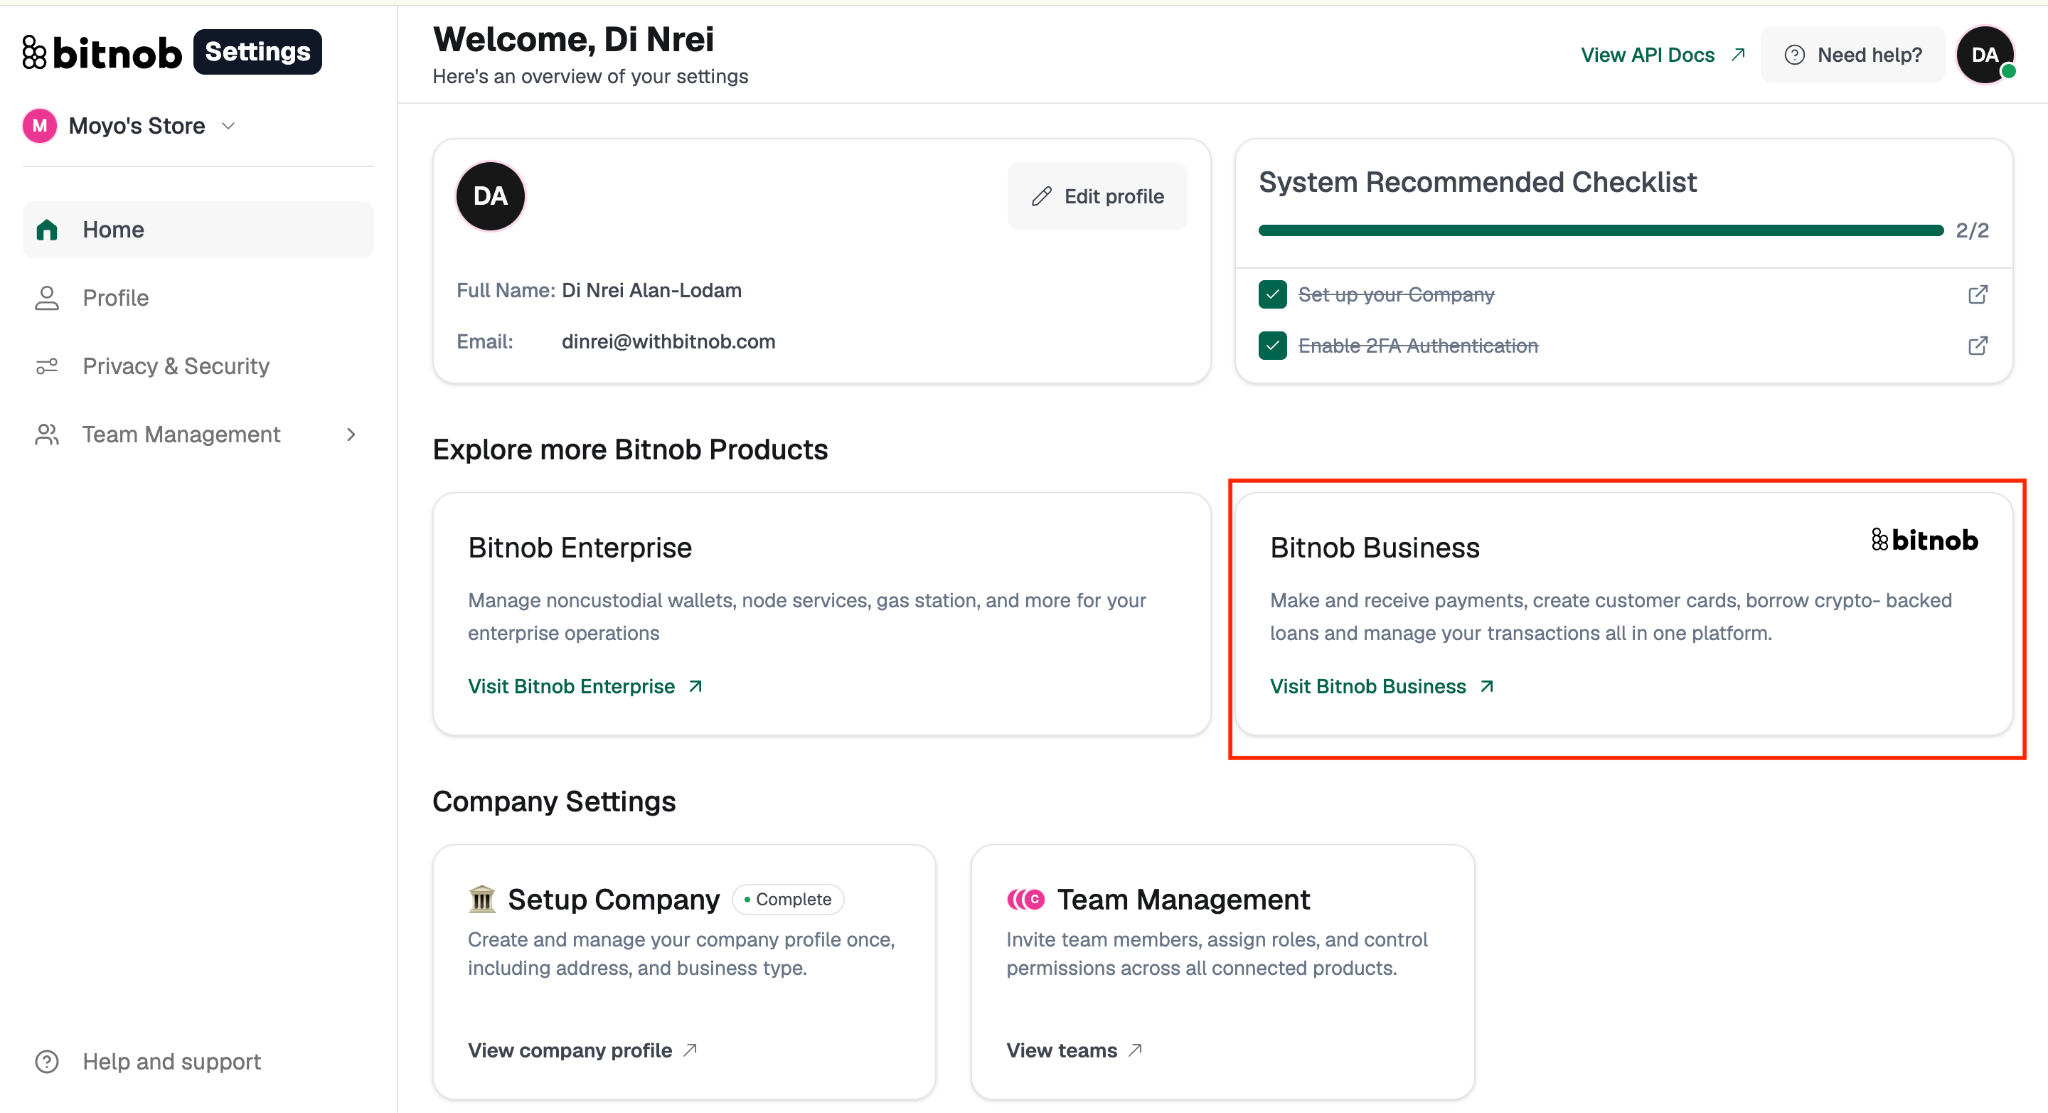
Clicking Business from the Settings page takes you into the Bitnob Business Dashboard. Here's a quick layout below;
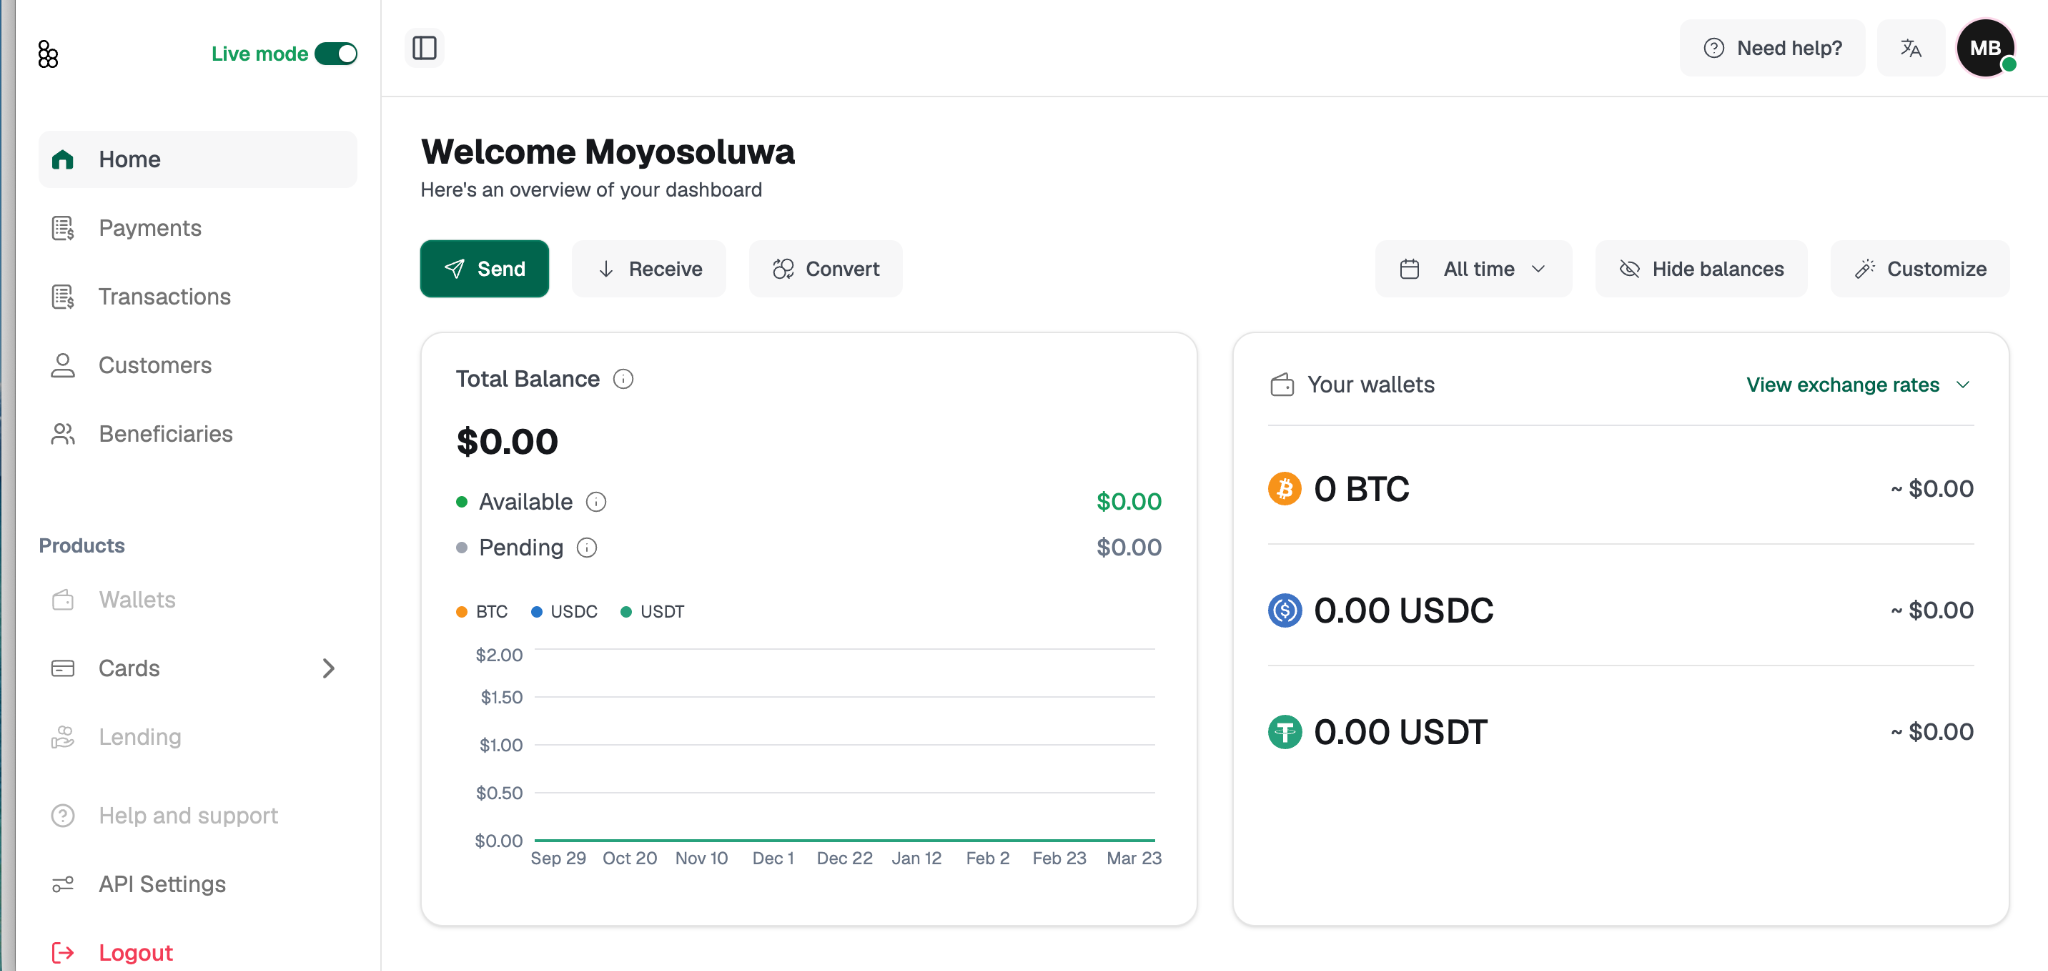
Home: A real-time financial snapshot: your total balance, wallet balances, quick action shortcuts, and recent transactions.
Payments: Everything to do with moving money. Send, Receive, and Convert all live here.
Transactions: A live filterable view of every Payments or Receipts through your account.
Customers: Records for the End-users your business transacts on behalf of.
Beneficiaries: Saved recipients for faster recurring payments transactions.
Wallets (Under Products): Individual management for your BTC, USDC, and USDT wallets.
Cards (under Products): Virtual Visa card issuance and management.
Lending (under Products): Crypto-backed credit facility, currently inactive.
API Settings: API keys, Webhooks, and IP Whitelisting.
Help and Support: You're already here.
Your Home screen: The Home screen is live and refreshes automatically. At a glance you'll see:
Your Total Balance: the aggregate value of all your wallets in USD equivalent, split between what's available immediately and what's pending release.
Your Wallets: live BTC, USDC, and USDT balances showing both the native amount and USD equivalent. Exchange rates are accessible from this panel too.
Quick Actions: Send, Receive, and Convert shortcuts that launch the same flows as the Payments section.
Recent Transactions: your latest activity with date, type, amount, status, and currency. For your full history with filters and export options, head to Transactions in the sidebar.
The Total Balance panel is also filterable. Use the time period dropdown to view your balance history across All time, Last 7 days, Last 1 month, Last 3 months, Last 6 months, or a custom date range you define. Click Customize to adjust how the chart displays: you can switch between a line graph and a bar chart, set your preferred time zone, and choose which currencies to show. You can display all three (BTC, USDC, and USDT) together or narrow it down to one or two.
Related articles: